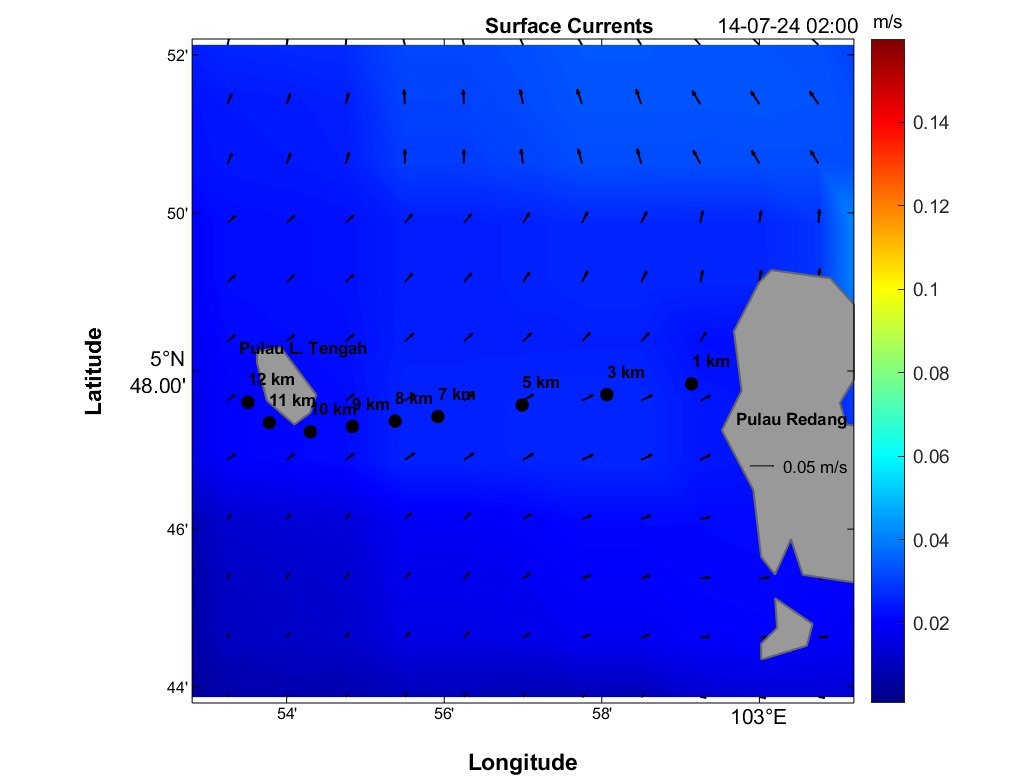
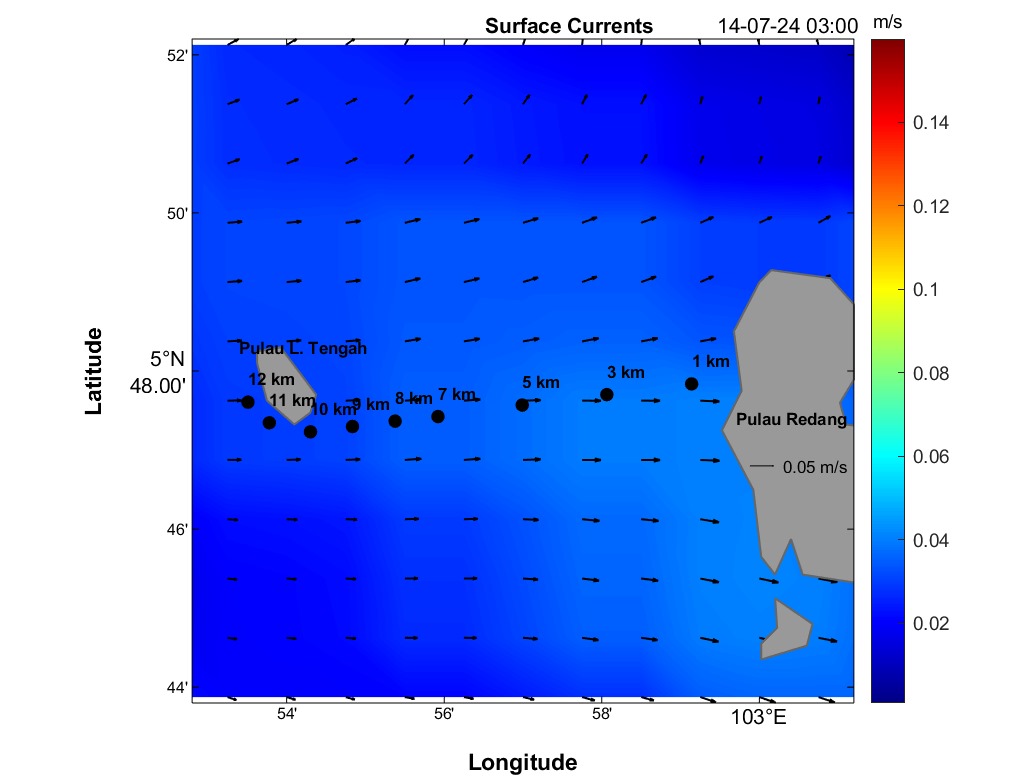
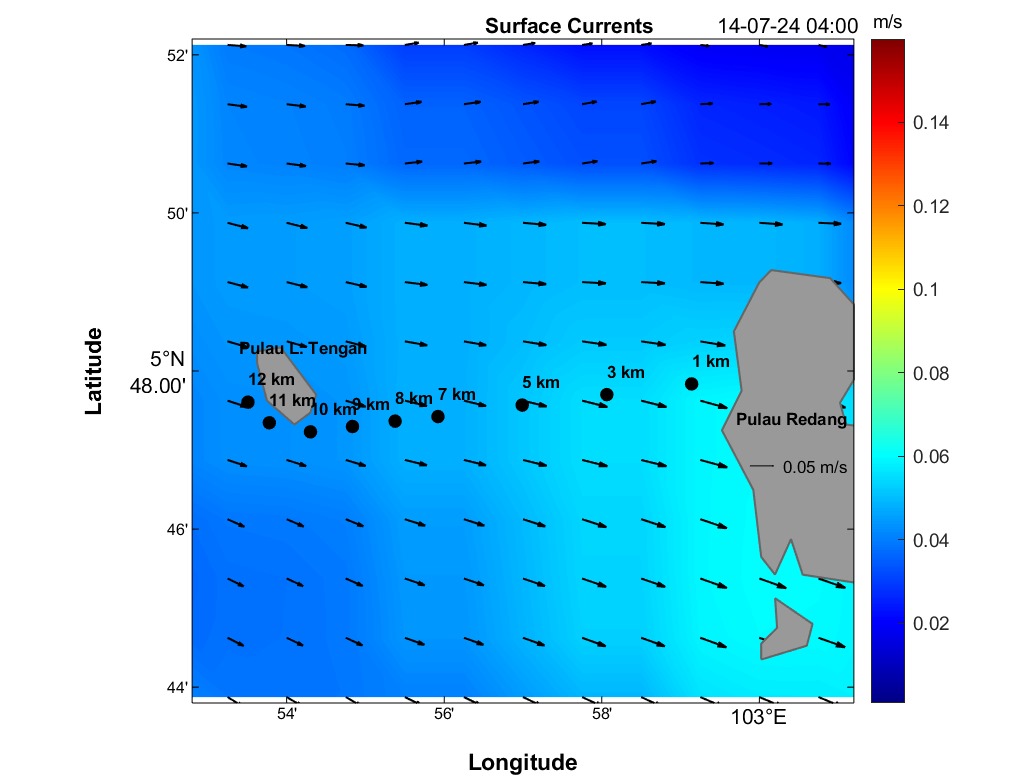
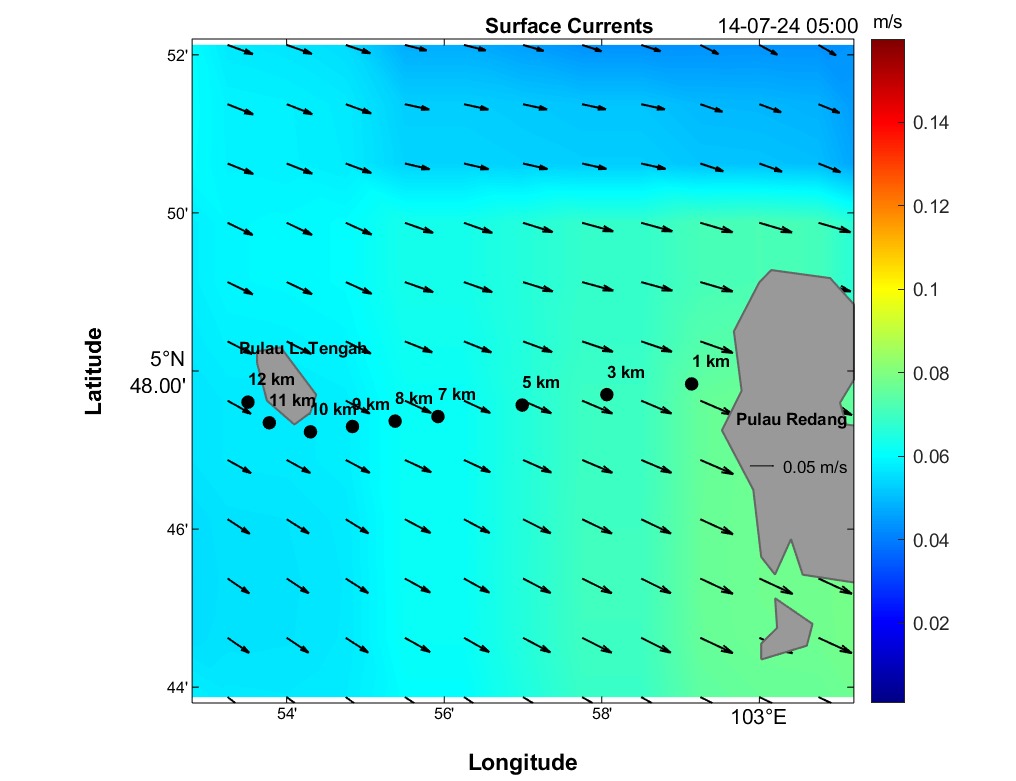
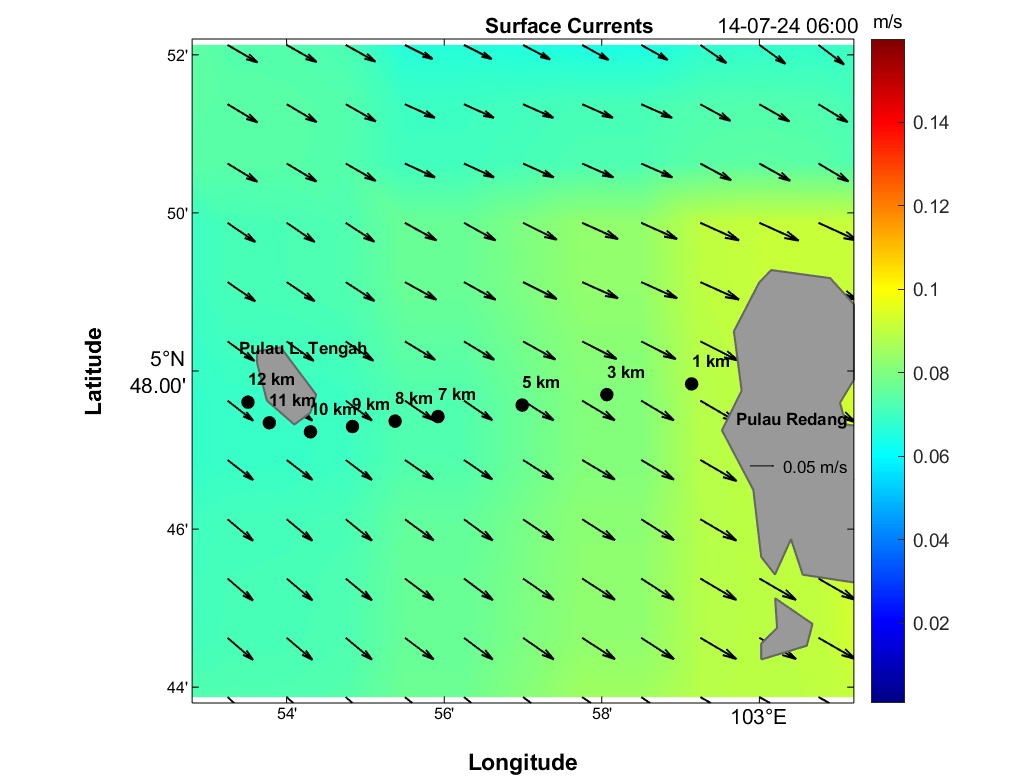
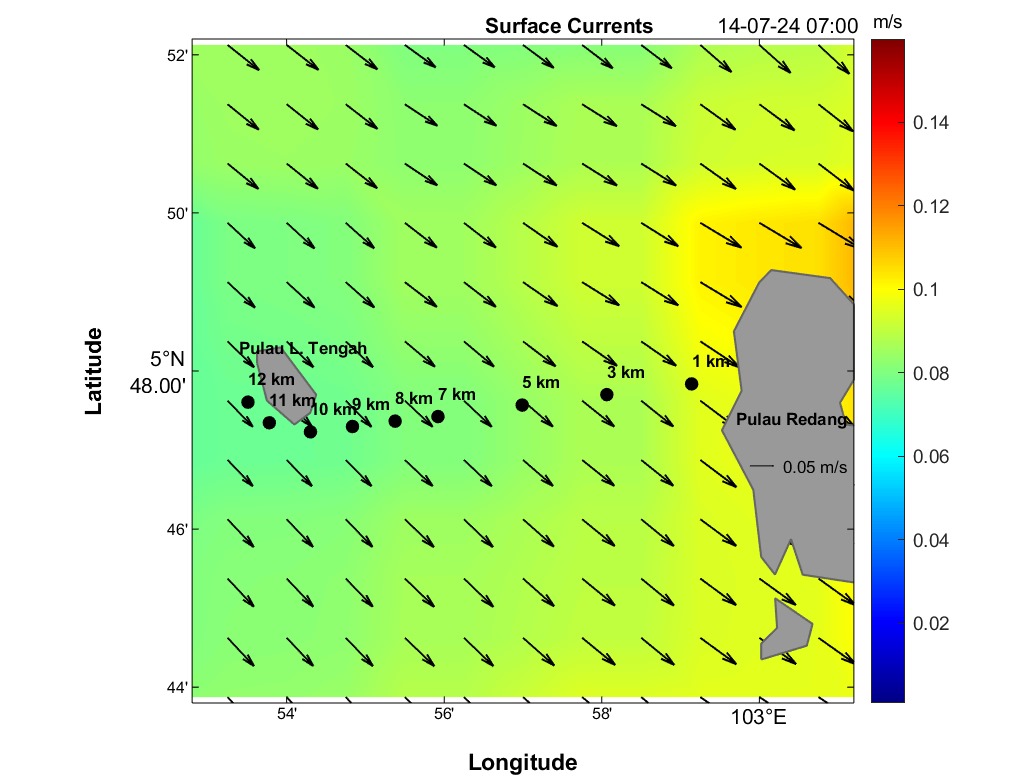
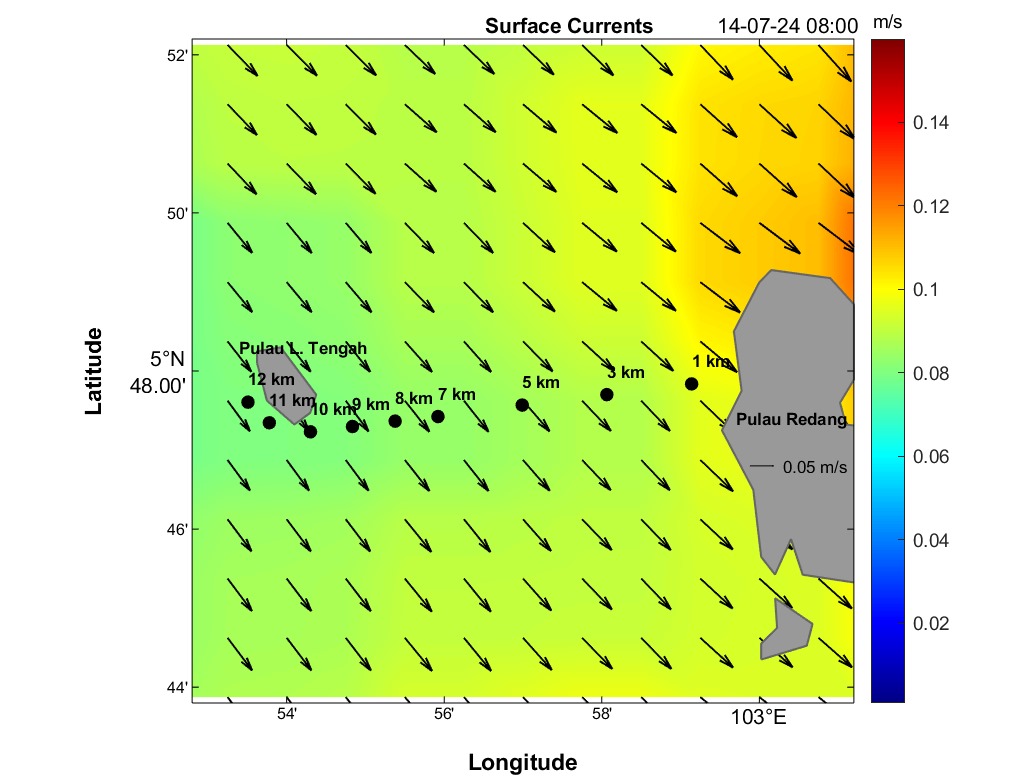
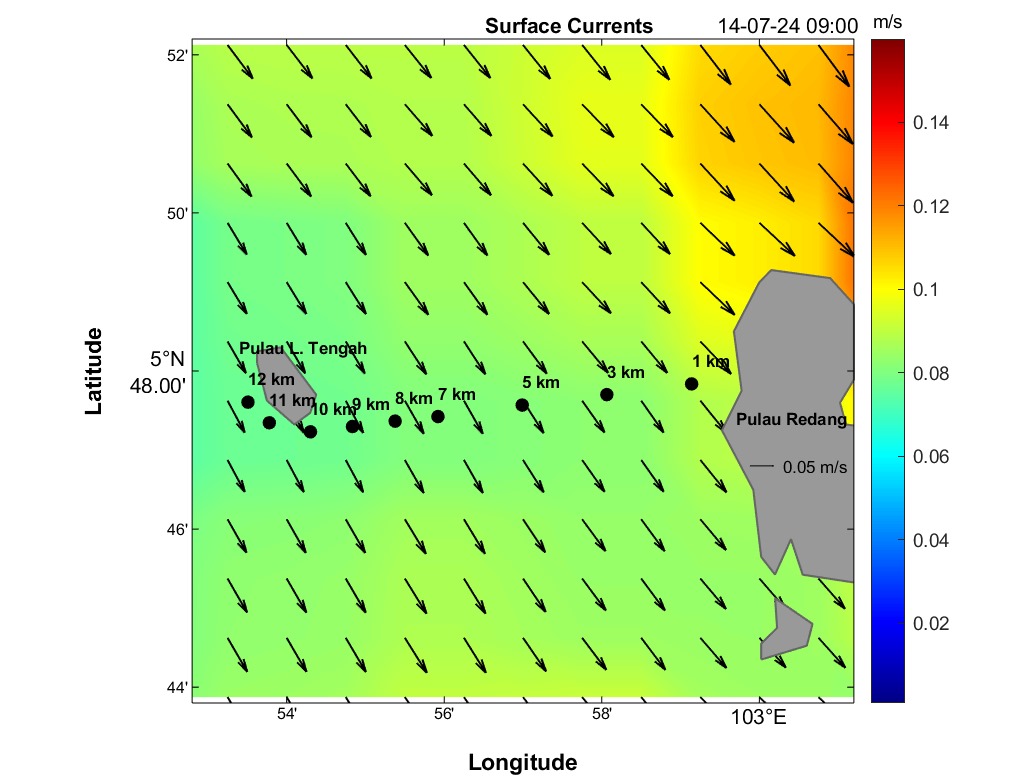
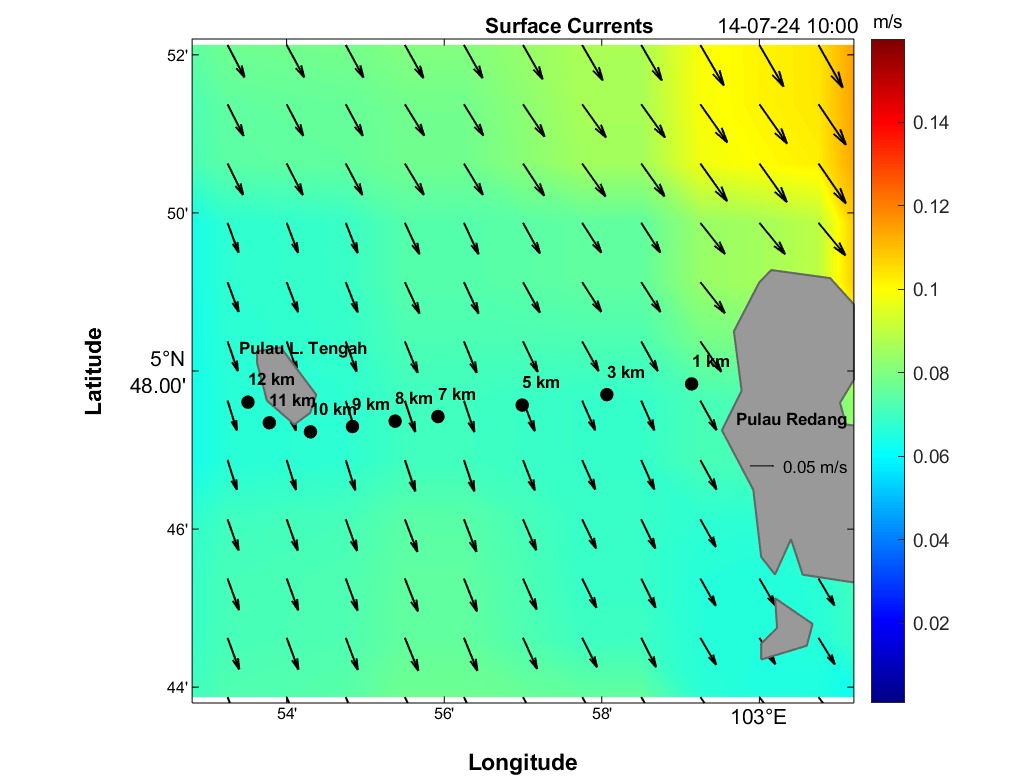
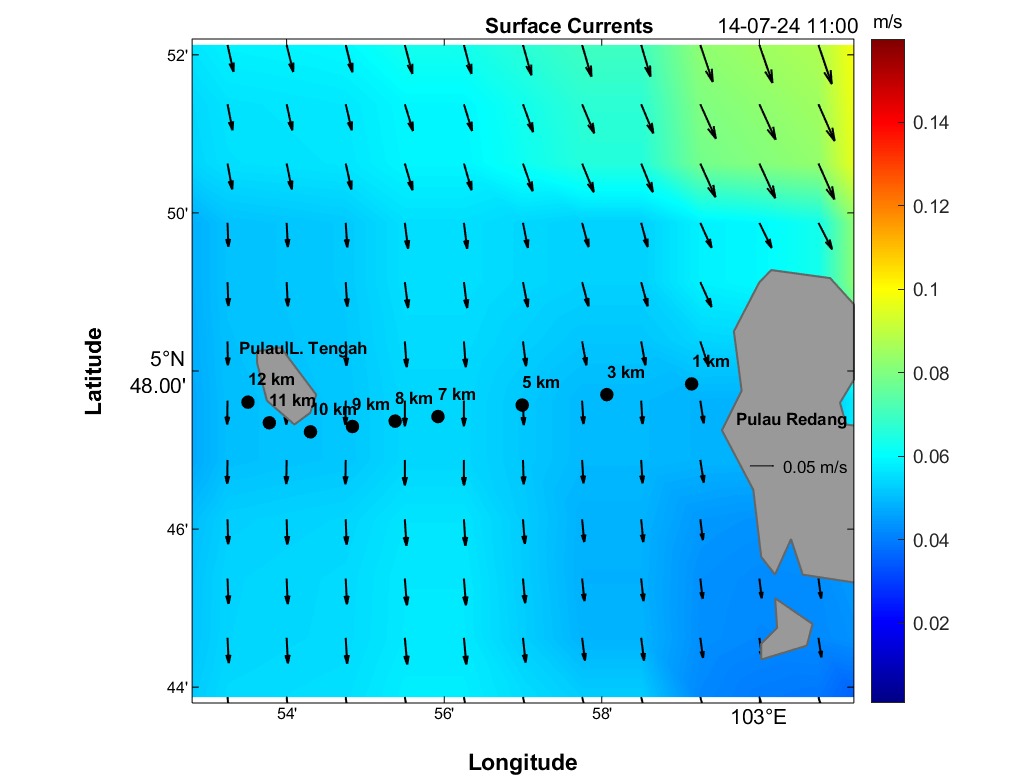
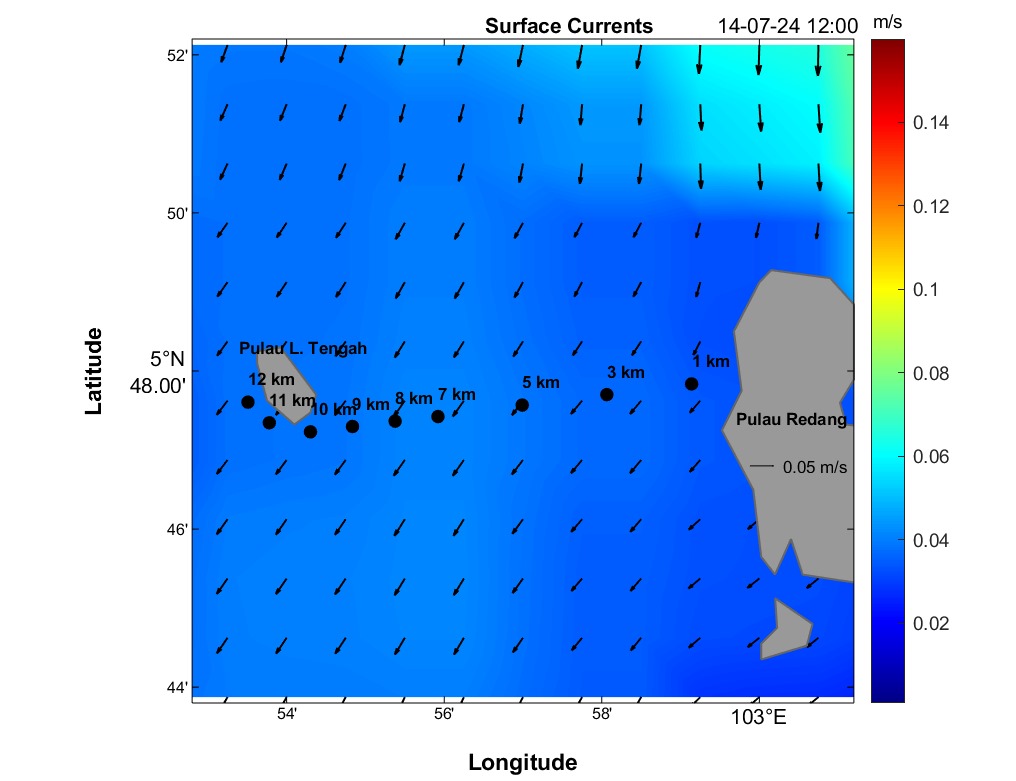
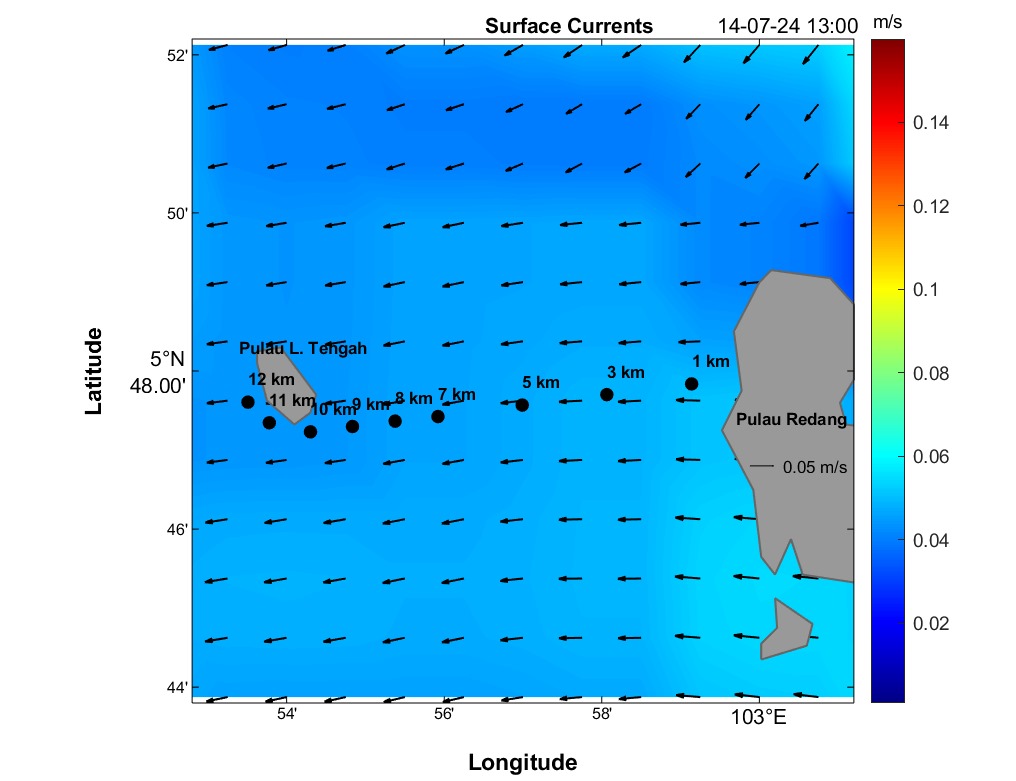
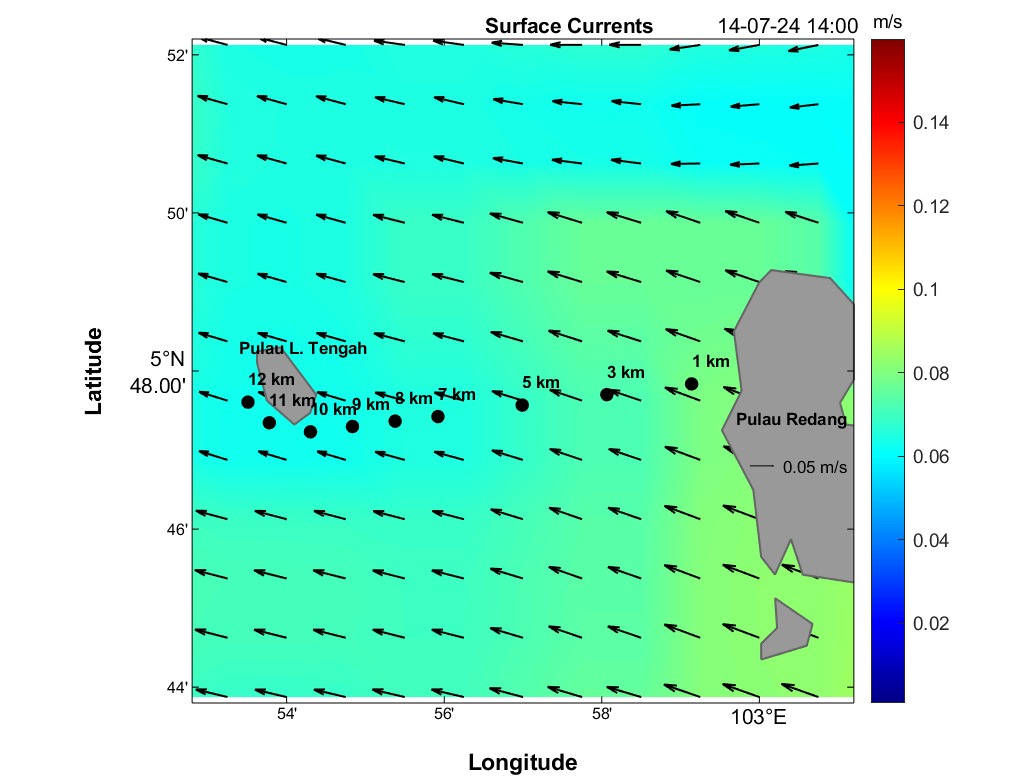
Map View of Ocean Currents (First Panel)
The first panel depicts hourly predictions of sea surface currents in a map format. Current speed is represented by color, and direction is indicated with black arrows. The legend displays current speeds in meters per second (m/s). Users can interact with the controls at the page's top to select a specific hour, animate the map, or navigate forward/backward with arrows. All time indications are in local Malaysia Time (MYT), and distance markers appear as black dots.
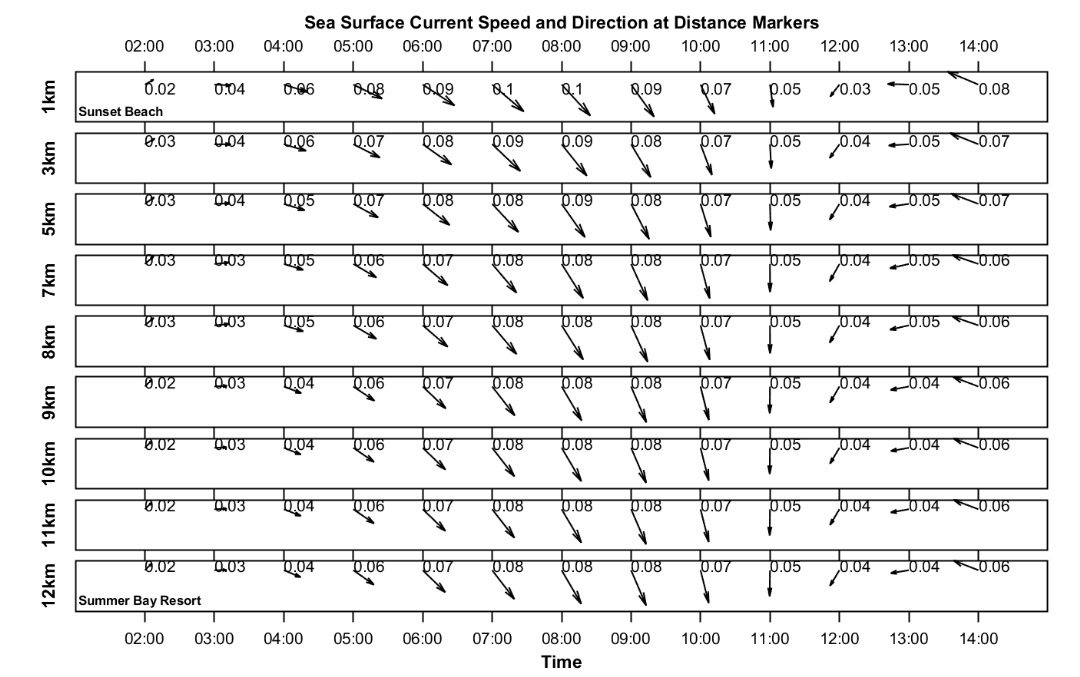
Time Vs. Distance Ocean Currents (Second Panel)
The second panel displays a time series of current speed (numerical values) and direction (arrows) for each distance marker. Time is on the horizontal axis, and the distance is between Redang Island and Lang Tengah Island. Although this plot contains the same information as the maps, it provides a more detailed view of direction and speed for any HOUR/DISTANCE combination. Arrows indicate the compass direction (north-south-east-west) an object would drift following surface currents. For instance, swimmers can use this plot to estimate expected currents along their route based on swim speed at any given distance and time.
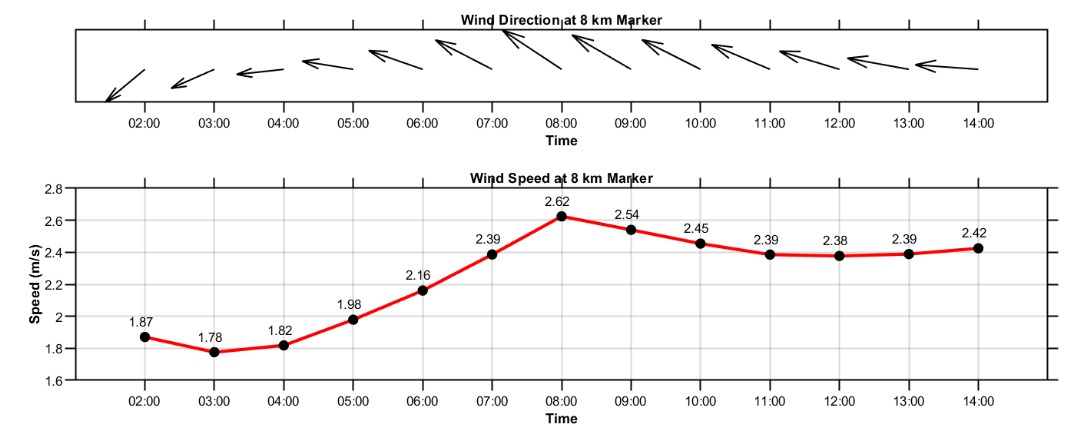
Mid-Channel Weather Forecast (Third Panel)
The third panel exhibits predicted hourly wind speed and direction in the middle of the swimming route, synchronizing with the figure above. Wind speed is represented by a red line, and wind direction is indicated by black arrows. Wind conditions are crucial for favorable swimming conditions, with speeds below 10 knots (5.14 m/s) considered desirable. Monitoring wind arrow direction is important, as a sudden change often signals the arrival of the sea breeze, indicating a rapid deterioration of ocean conditions. While exact sea breeze timing is challenging to forecast, this figure offers insight into its potential early or late arrival, to be interpreted alongside official weather forecasts from the Malaysia Meteorological Department.
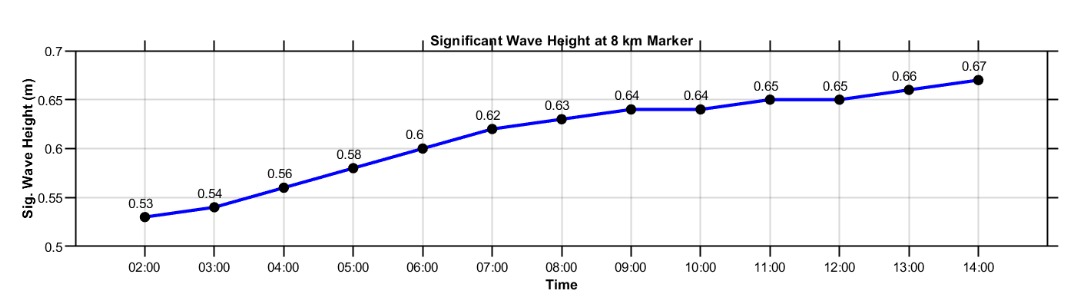
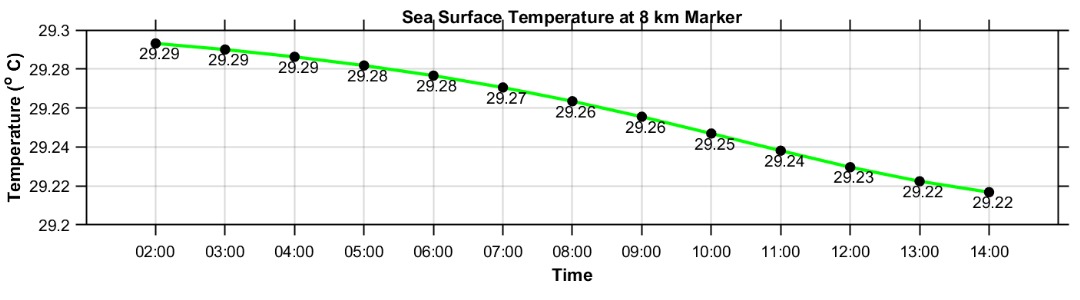
Mid-Channel Significant Wave Height and Sea Surface Temperature (Fourth & Fifth Panel)
The fourth and fifth panels display predicted significant wave height and sea surface temperature in the middle of the swimming route, aligning with the figure above. Blue and green lines represent wave height and sea surface temperature, respectively. Understanding wave height helps swimmers navigate through different wave patterns, reducing the risk of fatigue or injury. Sea surface temperature knowledge enables swimmers to prepare appropriately, wearing suitable gear to maintain body heat and prevent hypothermia.
DISCLAIMER:
This website serves informational purposes only. The information presented is not an officially interpreted forecast but results from numerical models. Ocean Hydro Sdn Bhd and associated parties bear no responsibility for the accuracy, completeness, timeliness, or quality of the data, and do not assume any responsibility or liability for any loss, injury, damages, or expenses resulting from the use or misinterpretation of information provided by the forecasts on this website.